Haaland underperforming and other insights we can learn from xG-based data

xG illustrates the chance value of a shot based on historical data - that is, how likely it is to result in a goal. It allows us succinct ways of talking about various things in football - most commonly, the pattern of play: which team is dominating a match with the better chances.
We can also use the stat to talk about individual performances. This is especially relevant for strikers, wide forwards and attacking midfielders as xG provides us with tools to talk about the effectiveness of goalscorers.
If a striker has a high xG value in a game or a season, they have had many good chances to score. If a striker has scored more goals than their xG suggests, they have outperformed their peers, based on what historical data suggests.
Comparing expected and actual goals leads us to identify three types of players. Firstly, those that score more than they should - i.e. have a higher goals count than xG count. Secondly, those that score just as much as they should (goals being roughly equal to xG). And lastly, those who underperform based on the chances offered to them (goals less than xG).
In what follows, to illustrate these three archetypes and how xG can be used to discuss performance value in football, we will present some well-known examples of players from around Europe's top leagues and how their goalscoring numbers compare with their xG stats in the ongoing league seasons.
Let’s get one thing out of the way first, we will not be considering all goals but just non-penalty goals. That’s because penalties distort stats away from a player's open-play performance. In the following, ‘npG’ refers to ‘non-penalty goals’ and ‘npxG’ means ‘non-penalty xG.’
All stats are accurate as of April 27th and taken from fbref.com. Read more about the underlying principles of xG here.
Elite goalscorers
A striker whose non-penalty goals are higher than their npxG essentially scores more than other strikers would have, given the same quality of open-play chances. Think of this as a striker who scores from outrageous angles, or long distances. In other words, an elite goalscorer.
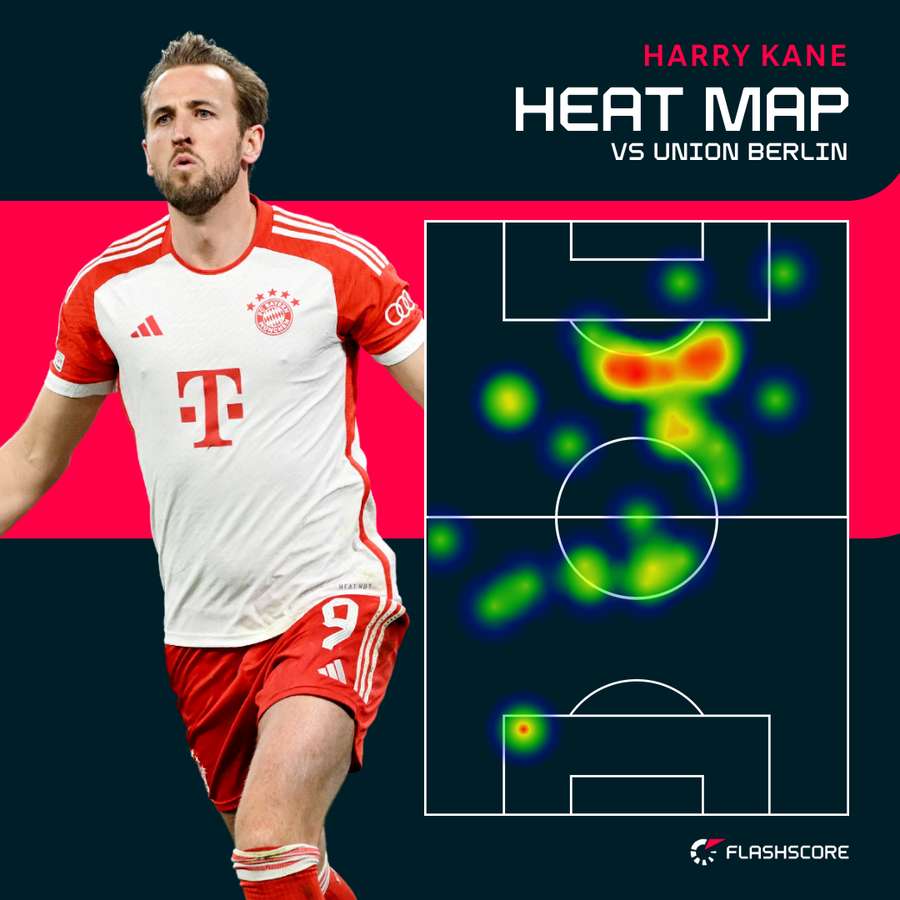
This season, a good and unsurprising example of an elite striker is Bayern Munich’s Harry Kane who has scored 30 npGs from an npxG of 25.4. Kane famously has a well-rounded game that sees him dropping deep often and finding himself outside the confines of a traditional ‘penalty box striker.’ His outperformance of his npxG reflects his tendency to shoot from distance and finish from angles that other strikers can't.

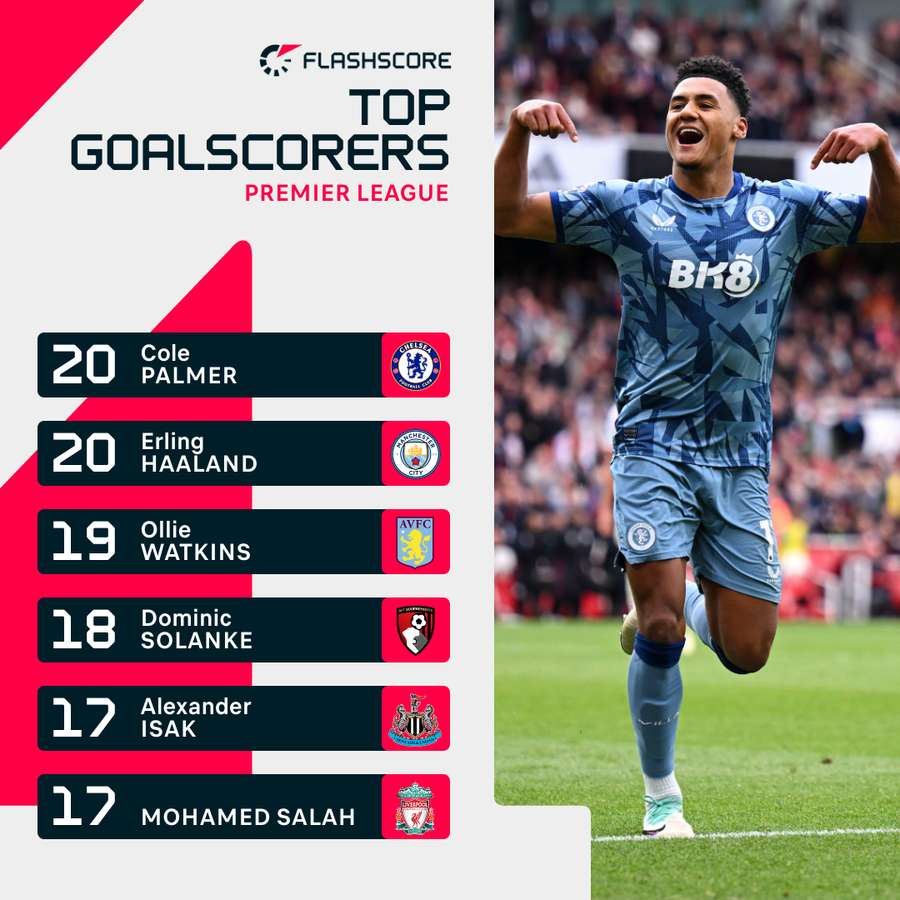
An even better example of this type of striker, at least statistically, is Inter Milan’s Lautaro Martinez who has scored 21 npGs from an npxG of just 14.2. PSG's Kylian Mbappe fits this mould too, albeit not fielded a classic striker in every match (20 npG from 13.4 npxG). As does Stuttgart’s Serhou Guirassy (21 npG from 14.9 npxG) and Aston Villa's Ollie Watkins (19 npG from 15.7 npxG).
A further interesting example is Real Madrid's marauding midfielder Jude Bellingham who has 16 npG from just 9.8 npxG. Cole Palmer is another nominal midfielder who has made headlines for his goalscoring this season. He has 20 league goals to date but nine of those have been penalties, remarkably. His 11 npGs have come from just 7.9 npxG, however. Despite his high tally of penalties, he is still an impressive case study.
Effective goalscorers
A player whose npGs are roughly equal to their npxG is essentially scoring the rate they should, the amount of goals a professional striker is expected to score given the chances they have received.
Artem Dovbyk of Girona is a good example this season. He has 14 npGs from an npxG of 13.8 - almost identical figures. Lille’s Jonathan David has a slightly better but similar scoring ratio - 15 npGs from 13.5 npxG.
Over in the Premier League, Newcastle's Alexander Isak (13 npGs from 12.8 npxG) and Dominic Solanke of Bournemouth (16 npGs from 15.8 npxG) are showing similarly even ratios in the season to date.
Liverpool's Mohamed Salah is also close to this ratio this season, although he is scoring a little lower than his npxG would suggest he should. Excluding penalties, he has scored 12 goals from an npxG of 13.2. This is pretty close to even but for a player of Salah's calibre, we might expect him to outperform his npxG. However, last season he displayed similar numbers (17 npGs from 18.5 npxG) and the season before he returned only slightly better figures (18 npGs from 17.8 npxG).

Profligate goalscorers
If a player has scored much fewer npGs than their npxG suggests they should have, they are scoring less than they ought to - indeed, less than the above types of players would.
Prominent examples in the Premier League of this type are, perhaps unsurprisingly, Liverpool's Darwin Nunez and Chelsea's Nicolas Jackson. Jackson has scored 10 npGs but has an npxG of 14.4. Nunez has scored 11 npGs but his npxG is 14.9. These returns are below expectations and reflect the criticisms of both these strikers as wasteful.
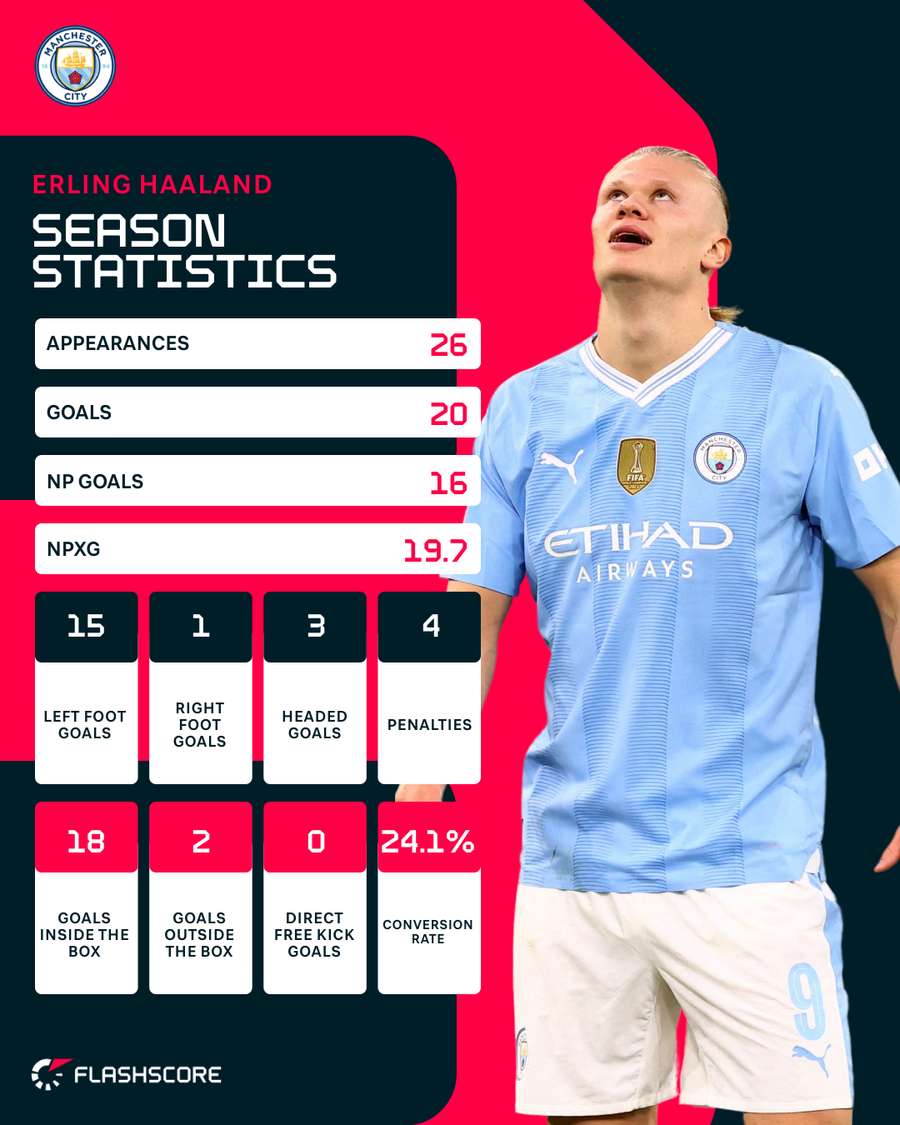
A couple of big names fit into this category that are much more surprising. Barcelona's Robert Lewandowski has scored just 10 npGs this season in LaLiga from an npxG of 13.6 while Manchester City's Erling Haaland has scored 16 npGs from an npxG of 19.7 in the Premier League.
Last season, Haaland greatly outperformed his npxG (29 npGs from 23 npxG) while Lewandowski was just about bang on (23 npGs from 23.5 npxG). All that is to say, they are both underperforming this season compared to their previous outputs. Lewandowski is on the wrong side of 35 so his tailing off isn't a huge surprise. Haaland, on the other hand, will be expected to turn his numbers around next season, especially considering he isn't lacking quality service at arguably the best club in the world.

xG (and its variants like npxG) isn’t for everyone but it’s now firmly entrenched in the parlance of football analysis whether you like it or not. It’s not a perfect stat, no stat is, but undoubtedly, it allows us to talk about players and the game with an ease that we couldn’t before.
Take what you will from the above analysis. Hopefully, it shines a light on who is overperforming and who is underperforming in Europe's top leagues. More than anything, it's meant to provide a template for talking about and evaluating the performances of the players we know and love in a more nuanced way.


